What makes things funny? Our own sense of humor isn’t always funny to the guy sitting next to us. So, let’s look at a few simple principles used in Improv to make your video funny to all of your audience!
First and foremost, there is TRUTH in COMEDY! The funny comes from the experiences we have all had in our lives. Think about sitcoms, why do they work? They take something so simple, like everyday life and exploit it. The ups and downs of dating and heartbreak or fighting for that perfect job, only to find out that it isn’t so perfect. But where does the comedy come from?
The funny comes from the unexpected. The moments of truth. It comes from showing not telling. We have all been there…the time in the grocery store when two people are having a conversation in public and you can’t help but listen, even though you know the topic should have probably been left at home…yeah that stuff.
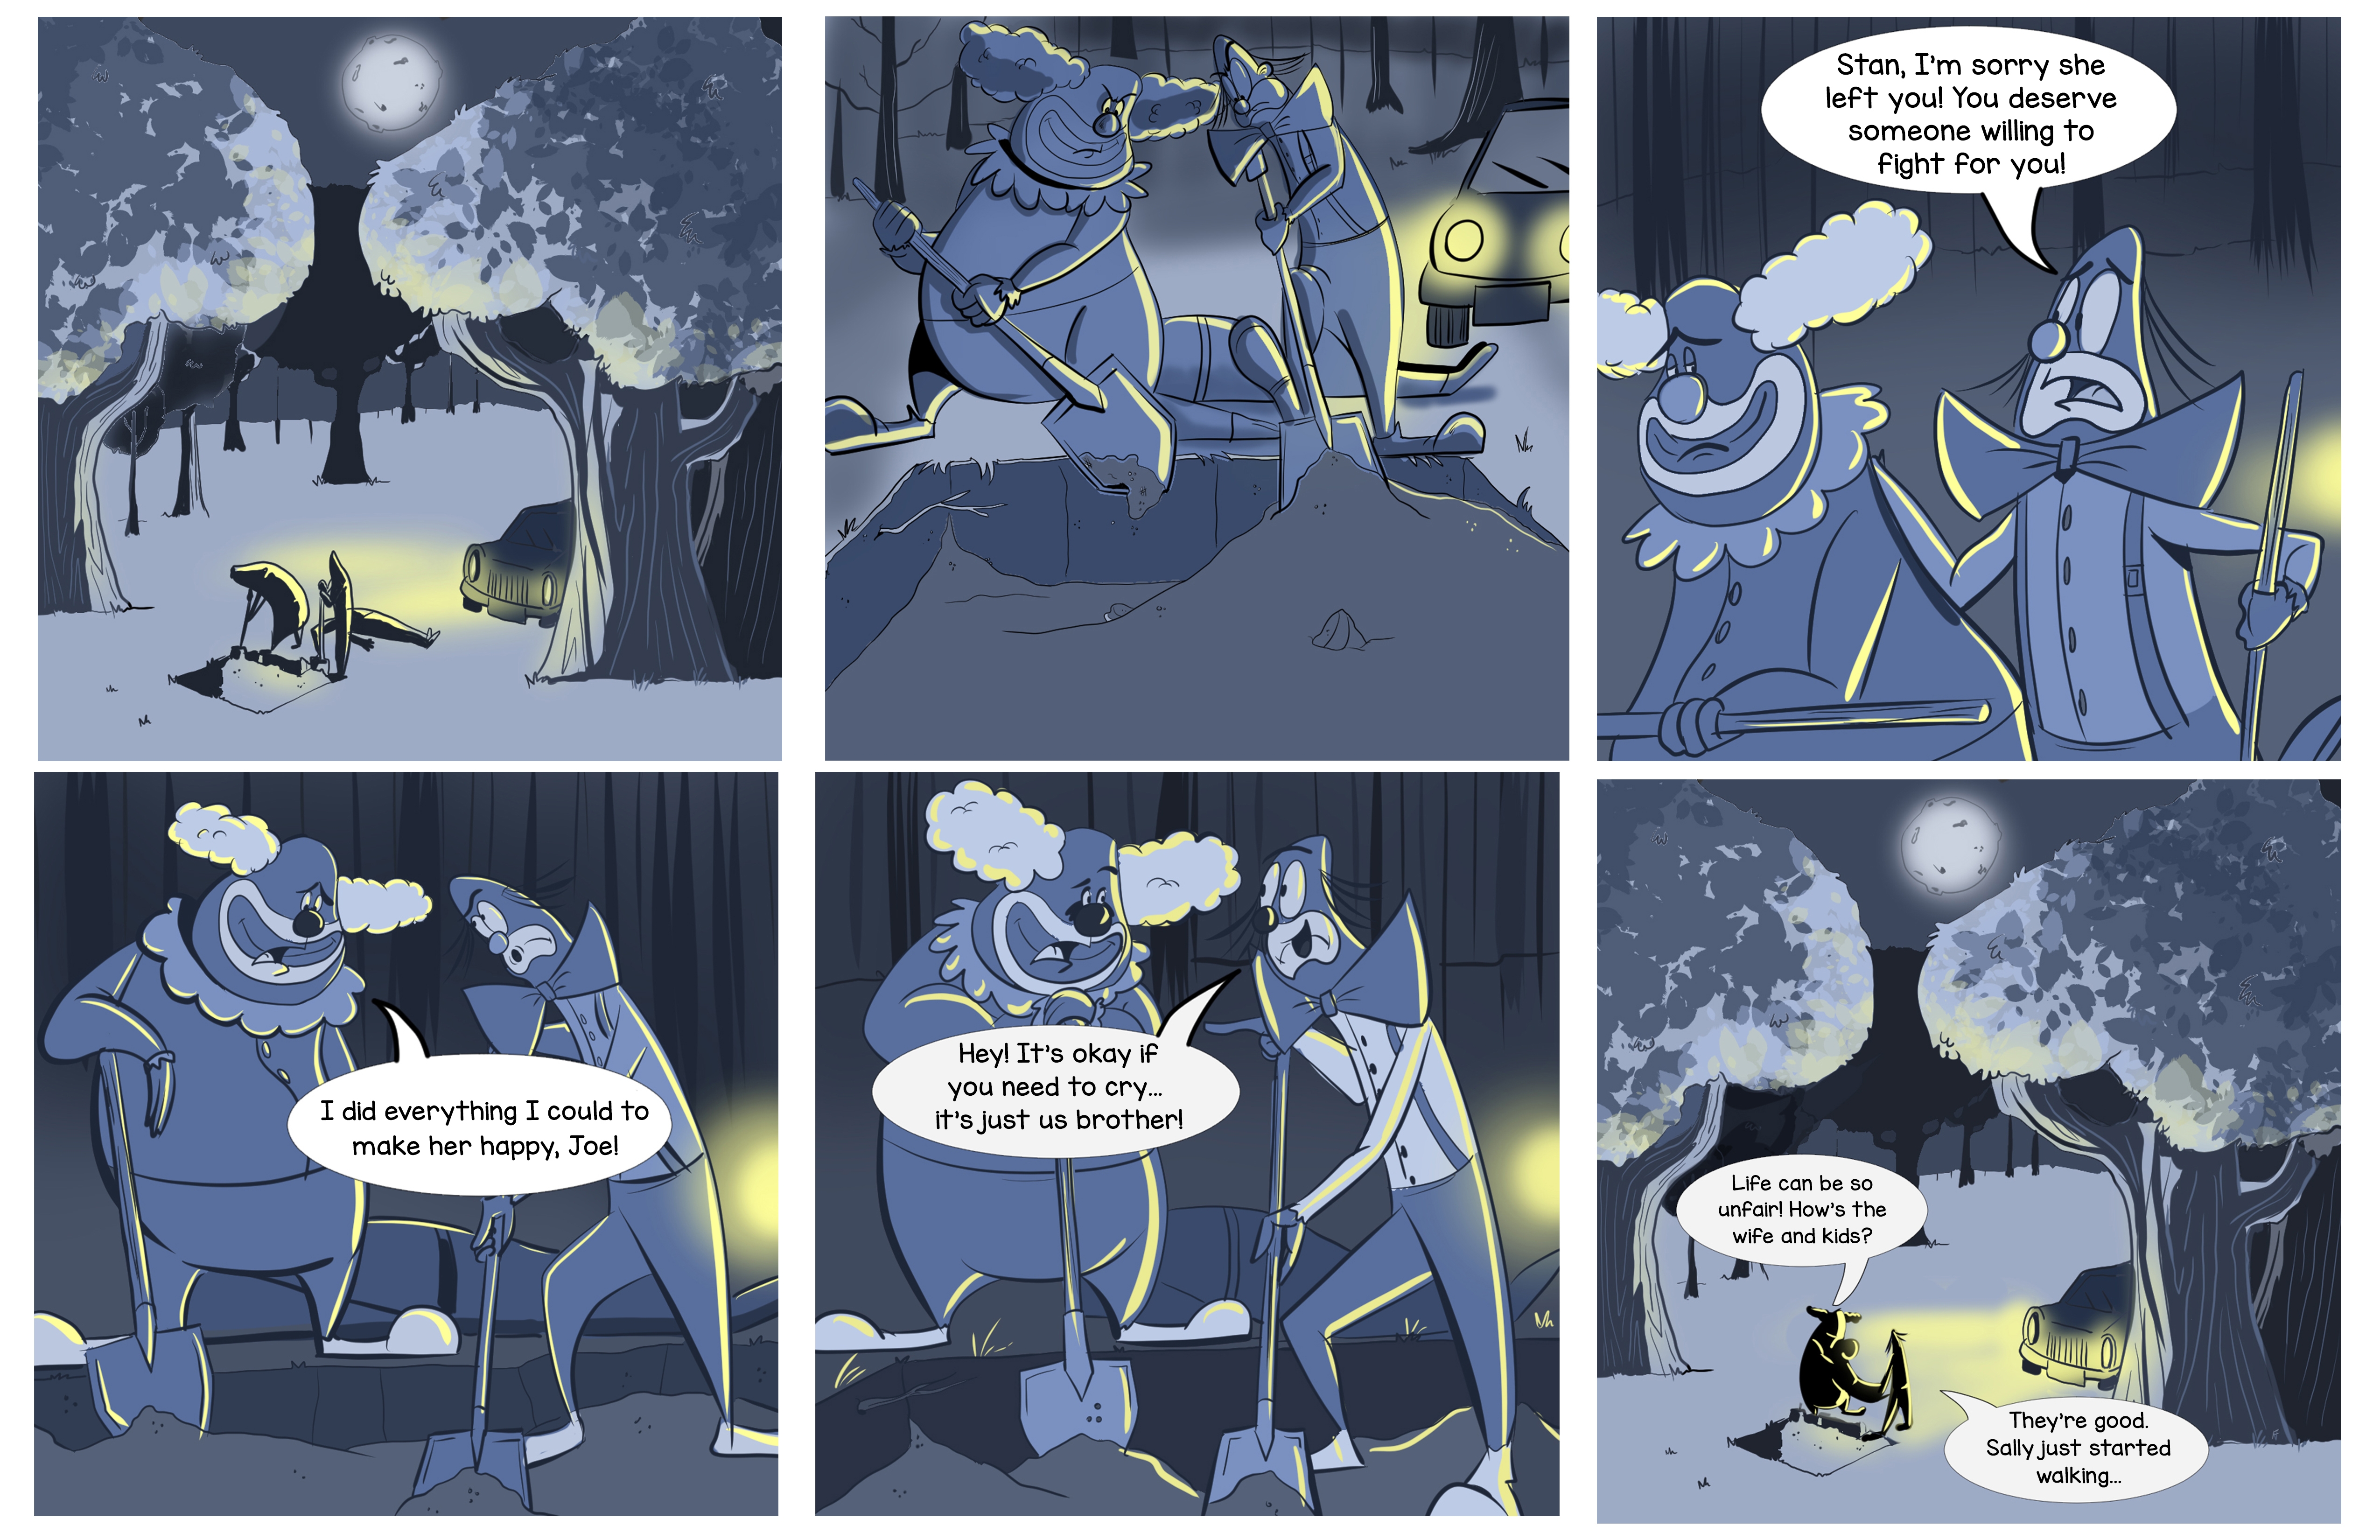
So let’s take a look at this funny scenario….
We see two shadowy figures digging holes in a graveyard. It’s dark, but we can see that there’s a body behind them. It appears that they are covering up a murder! The scene is quite grim and creepy… so how is this funny? The car lights flicker on and we get a better look of the situation… only to reveal…two clowns? Okay, now this is way more terrifying, but their must be more to the story… so as we get closer, we overhear…
Clown 1:“Look Stan, all I’m saying is I’m sorry she left you. You deserve better!”
Clown 2:“You know Joe I just don’t understand, I did everything I could to make her happy.”
Clown 1:“Hey, you know, it’s okay if you want to cry. It’s just us brother.”
Clown 2: (in tears) “Life is just so unfair! But hey how’s the wife and kids?”
Clown 1: “They’re real good. Sally just started walking…”
The conversation continues as they are digging a shallow grave wearing their clown costumes. So, we know they are clowns, we know they are friends, and we know what happened…but they don’t have to tell us that they murdered this guy. We just know! If we focused on the body, or what happened the scene would drag on, the audience would get board with details and information that they don’t need.
This scenario leads us to the truth of comedy…Relatability!
Think about how you feel when you pop bubble wrap. Did that put a smile on your face just thinking about it? How about when you scoop peanut butter from a freshly open jar, yeah there’s that satisfaction face. See how easy it is to relate? All you have to do is capture a moment when someone has used your product in such a way that it brings a clear feeling to your audience.
Just remember that comedy is subjective, but so is being bored out of your seat. By using these tried and true principles of Improv Comedy, you can help your audience laugh at the unexpected, learn about your great product/service and keep them interested and wanting more.
So, let’s get out there and take a fresh approach to comedy, and whatever you do, if you see two clowns walking your way…RUN!
The Ydraw Guru — purveyor of nonsense knowledge, convoluted conclusions, wacky wisdom, and wrong-headed reasoning.
Q. Dear Ydraw Guru. What causes muscle cramps? tim
A. Snorkeling…in a wheelchair. Why? It is a simple matter of the scientific principle “form follows function.” Just look at a snorkel and doesn’t it look like a muscle cramp in action? It’s all twisted and makes you clench your teeth and breathe like Darth Vader. As for the wheelchair…I don’t dare say too much for fear of nasty comments from wheelchair manufacturers but the next time you go snorkeling in a wheelchair take notice if you don’t start to feel a big muscle cramp developing in your lungs.
Q. Dear Ydraw Guru: I was happy that Obama won the election but I know a lot of people are angry. Conservatives seem to favor the rich and liberals favor the poor. Isn’t there a way we can all be happy? Ellen.
A. Ellen, you’ve asked a question so easy to answer that it won’t display my powers of logic and reasoning to their fullest. But I suppose even easy questions need answers so here it goes.
It’s true that half of the country is happy right now and half is dismayed, depressed and even angry. But as Obama promised, hope and change are on the way. History and a little educated forecasting by yours truly shows us we are on the right path. You see in 1980 only about 20% of our population needed government assistance and now we’ve progressed to 47% with more progress to come. Here’s how it will work.
It’s really a simple cause and effect equation. As liberals raise taxes on the rich, the rich will layoff more people from their companies which will create more poor people on government assistance which will mean taxes will have to be raised on the rich again and there will be more layoffs and more poor on government assistance. Up to this point conservatives will still be unhappy but then the tide will start turn for them. The rich will not like the high taxes and many will try to escape with their money. The government won’t allow that because then they won’t have anyone to tax and so they will erect a strong fence along all our borders which should make conservatives happy that government will finally be controlling immigration. And conservatives will soon see another favorite program being enacted– the flat tax. To pay for people’s welfare needs the government will have to institute a simple flat tax (of 100%). The few rich people left will finally join the ranks of the poor and all will be equal. And if everyone is equally poor then one could also say everyone is equally rich. This means everyone will be rich which should make conservatives happy and everyone will be poor which should make liberals happy. I challenge anyone to find a flaw in this logic. All we need is a little patience for hope and change to take effect and make everyone happy. It is really as simple as that. Now on to important questions that cause me a little bit of strain.
Q. Why are men so visually stimulated?
A. Men…visually stimulated? Obviously, this question comes from a woman. (I’m a genius when it comes to women) This is a modern-day myth perpetuated by hair salons and beauty cream manufacturers. Think about it. When is the last time a man noticed that the bathroom had just been cleaned, or that you had just put a colorful bouquet of flowers on the table or that the kids were sticking spaghetti sticks up their nose? Have you ever heard your man as you walk in to the neighbor’s house and comment on the beautiful carpet or reply in surprise when you walk through the door, “Honey, you’ve done something new to your hair?” (Unless you just came back from chemotherapy and forgot to put on your wig.) The fact is men have a much higher threshold to overcome to get any visual response jolting through their synapses and registering in their brains. Just as women according to tests have a higher pain threshold which is why they put up with men in the first place.
Q. Why are gas prices so high?
A. It all has to do with inflation of the lower intestines and…oops, that’s another kind of gas. Filtering this through my massive reservoir of useless knowledge I realize now that you are referring to gasoline, the petroleum product. The short answer to your question about high gas prices is— Dentists.
Understanding why though takes a little more research and reasoning. You see oil workers learned that dentists get paid hundreds of dollars for drilling a few millimeters through a hard rocky substance while they are getting paid much less to drill for miles through another hard rocky substance. So the Petroleum Products Union (or the double P. U. as they are fondly referred to) investigated the reason why dentist are able to charge so much more for drilling so much less. The union employed a skilled mathematician who came up with this formula—D x P2 = $$$$. (Where D=dentist and P=-pain.) Therefore, the double P.U. deduced that people will pay a premium for pain. That’s why we now have higher prices called “Pain at the Pump.”
Excerpt from U.S. Department of Labor
"People tend to eye-minded, and the impacts visual aids bring to a
presentation are, indeed, significant. The studies, below, reveal
interesting statistics that support these findings:
- In many studies, experimental psychologists and educators have found
that retention of information three days after a meeting or other
event is six times greater when information is presented by visual and
oral means than when the information is presented by the spoken word
alone.
- Studies by educational researchers suggest that approximately 83% of
human learning occurs visually, and the remaining 17% through the
other senses - 11% through hearing, 3.5% through smell, 1% through
taste, and 1.5% through touch.
- The studies suggest that three days after an event, people retain
10% of what they heard from an oral presentation, 35% from a visual
presentation, and 65% from a visual and oral presentation.
"Presenting Effective Presentations with Visual Aids" May 1996
OSHA Occupational Safety & Health Administration U.S. Department of
Labor
http://www.osha-slc.gov/doc/outreachtraining/htmlfiles/traintec.html

Excerpt
Recognition Information
To communicate information that people need to recognize, pictures are
extremely effective. In one study (Shepard, 1967), people looked at
600 pictures, sentences, or words. On an immediate test, recognition
accuracy was 98% for pictures, 90% for sentences, and 88% for words.
Another study (Nickerson, 1968) found that people had 63% recognition
accuracy for a group of 200 black and white photographs one year after
initial viewing. Other researchers (Standing, Conezio, & Haber, 1970)
showed people 2,560 photographs for 10 seconds each. After three days,
the study participants recorded recognition accuracy of over 90%. Read
and Barnsley (1977) showed adults pictures and text from the
elementary school books they used 20 to 30 years ago. Recognition
accuracy rates for pictures and text were better than chance, with
pictures alone being recognized more accurately than text alone.
Finally, Stoneman & Brody (1983) found that children in visual or
audiovisual conditions recognized more products in commercials than
children in an auditory only condition. Pictures seem to allow very
rich cognitive encoding that allows surprisingly high recognition
rates, even years after the initial encoding took place.
Spatial Information
Illustrations are superior to text when learning spatial information.
For example, Bartram (1980) arranged for college students to learn how
to get from a starting point to a destination using a minimum number
of buses. The researcher presented the bus route information via maps
or lists and asked the students to provide as quickly as possible the
correct list of bus numbers in the correct order. Bartram measured the
time it took to correctly complete each bus route task. The study
found that the students learned the bus route information more quickly
when they used a map than when they used lists. Bartram believed that
the students performed a spatial task, and the maps were superior to
lists because the map presentation of information is consistent with
people's preferred internal representation of spatial information.
In an exploratory study, Bell and Johnson (1992) allowed four people
to select pictures or text for communicating instructions for loading
a battery into a camera. Qualitative results showed a strong
preference for pictures rather than text. The researchers believed
that the information to be communicated was spatial, and that the
results supported the hypothesis that spatial information should be
presented pictorially. "
"Multimedia Information and Learning" by Lawrence J. Najjar, School of
Psychology, Georgia Institute of Technology, 1996 Journal of
Educational Multimedia and Hypermedia, 5, 129-150.
http://mime1.gtri.gatech.edu/MiME/papers/multimedia_and_learning.html

Excerpt
"Long-Term Retention
One of the basic ways that illustrations aid retention relates to the
well-researched (but not undebated) dual-coding theory of memory
(Paivio, 1971). This theory proposes that information is stored in
long-term memory both as verbal propositions and as mental images. It
suggests that when information is presented verbally and visually it
has a better chance of being remembered. Corroborating research shows
that concrete words are remembered better than abstract words, and
that pictures alone are remembered better than words alone (Fleming &
Levie, 1978). From the dual-coding perspective, an explanation is that
concrete words help us generate associated mental images, and that
pictures alone help us to generate associated words, in addition to
detailed mental images. The combination of verbal proposition and
mental image establishes multiple pathways by which the information
can be retrieved from memory...
Retention in Working Memory
Illustrations can also be seen as assisting the short-term or working
memory by making more information readily available. Illustrations can
present simultaneously all the information needed to explain a topic
or perform a task. Where a linear string of words must use a series of
semantic cues to its organization over the course of its passage, an
illustration can use lines, boxes, arrows, space, color, typefaces,
and the relative distance between elements to communicate information
about the relationships of those elements. Because the reader can see
this information at a glance or with minimal study, graphical
presentation can be more efficient than words alone (Winn, 1987). For
example, charts with multiple columns and rows can reveal the complex
relationships between large amounts of information. Such information
would be difficult to present and even more difficult to comprehend in
words alone. When students read prose or hear exposition, they have to
hold information in working memory long enough to relate it to
information presented later– a difficult task in a long passage.
Simultaneous presentation can reduce the processing load on the
working memory and thus help students better see relationships within
the information."
"The Instructional Role of Illustrations" Cooperative Program for
Operational Meteorology, Education and Training
http://www.comet.ucar.edu/presentations/illustra/illustrations/illustrations_new.htm

Excerpt
"Mayer and Anderson's (1992) contiguity principle asserts that
multimedia instruction is more effective when words and pictures are
presented contiguously in time or space. Studies involving multimedia
instruction have shown that learners perform better on problem solving
and recall tasks when related text or narration are close to an
illustration or animation sequence rather than when they are far away.
In a series of studies reported by Mayer and his colleagues (Moreno &
Mayer, 1999; Mayer, 1997) students read a text passage or listened to
a narration describing a cause and effect system (e.g., how a bicycle
tire pump works) and either studied a diagram or an animated sequence
illustrating the process that was described verbally. In each study,
students receiving text contiguously in space (text physically close
to the diagram or animation) or time (narration chronologically close
to the animated sequence) performed better on recall and problem
solving tasks than students under less contiguous conditions. The
current research was designed to determine whether the contiguity
principle applies to leaning from geographic maps. Comparing rollover
and hyperlink features to a separate narrative allows us to study this
variable experimentally....
It was hypothesized that learners who study a map with animated
features would more successfully encode both map feature and map
structure information than learners who studied a static map. Few
research studies have been reported on the role of animation in
learning from geographic maps. However, research integrating animation
with simulations (Rieber, 1996), graphic organizers (Blankenship &
Dansereau, 2000) and problem solving tasks (Ok-choon Park & Gittelman,
1992) have shown positive effects for animated over static displays."
"Effects of Fact Location and Animation on Learning from Online Maps"
Jul 31, 2001 by Steven M. Crooks, Michael P Verdi, David White Texas
Tech University.
http://tigersystem.net/aera2002/viewproposaltext.asp?propID=3303

"IS THERE A DIFFERENCE IN THE LEARNING PROCESS WHEN MULTIMEDIA IS
INVOLVED? At the University of Maribor in Slovenia,
electroencephalography (EEG) was used to measure brain activity when
exposed to different media... The results show that students find it
difficult to form mental models from text alone. Multimedia
presentations trigger visualization strategies such as mental imagery,
which is crucial to many kinds of problem solving."
"The Affect of Multimedia on the Learning Process" Encyclopedia of
Educational Technology
http://coe.sdsu.edu/eet/Articles/Affectmulti/start.htm
Contact Ydraw for more information about video scribing and whiteboard animation. Or if you just wanna say hi to us.
Introducing Yswipe… the new cut out videos created by Ydraw.
These videos are a great way for businesses to market their products, ideas, and to help explain difficult concepts in a simple way. Ydraw had never attempted a video like this before, but after some thought and innovation we are so happy to announce that we now offer these as an option to all of our clients! The Yswipe videos are a new spin on the original whiteboard video and we are obsessed with them!
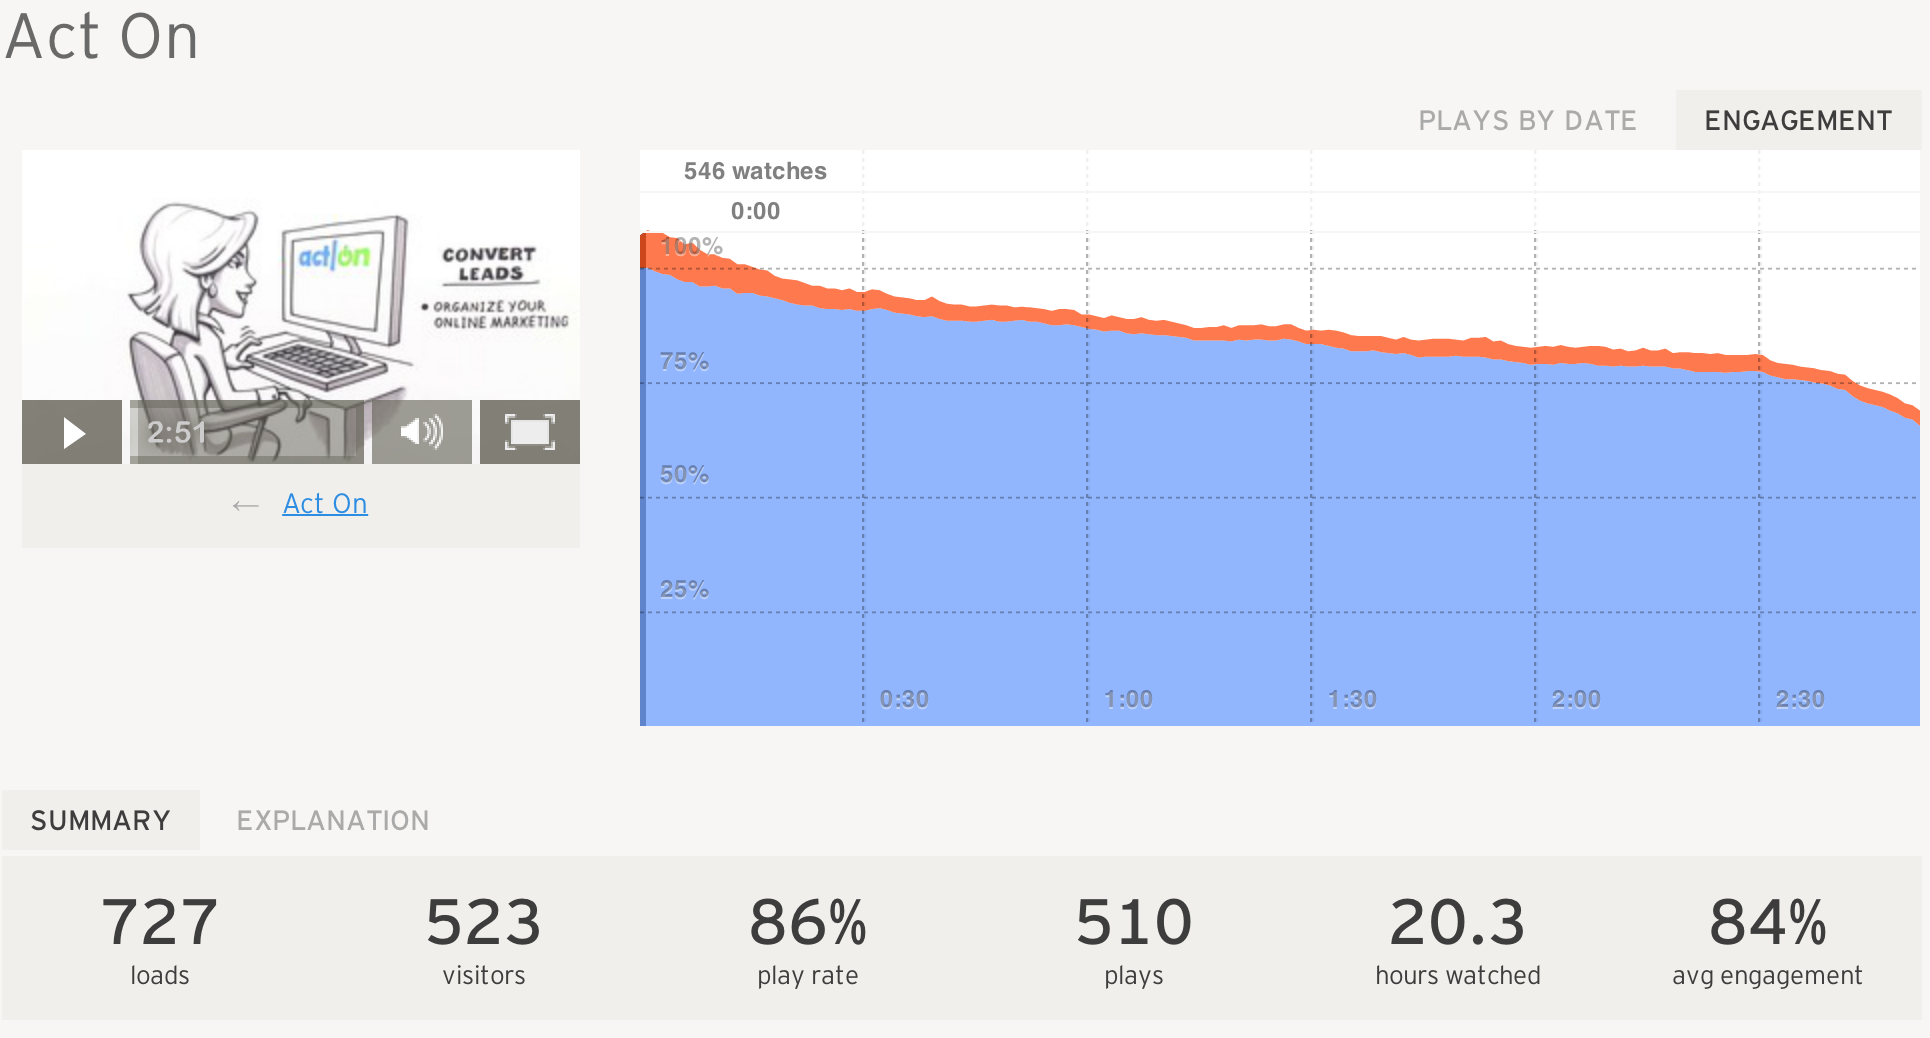
Let’s check out the stats these videos produce. We ran some tests here at Ydraw and the results are pretty impressive (if we do say so ourselves). In just a short period of time, the page where the video is embedded has been loaded 145 times by 114 people. 91% of these people played the video a total of 122 times, and spent a total of 3.1 hours watching it. On average, each of these viewers watched 86% of the video! Now that…is what we call incredible. We are certain that as the video continues to receive views, the stats of the video will maintain these high percentages and hopefully even increase viewer engagement.
At Ydraw…we are always looking to create and implement new ideas. So, when you see something you want…chances are Ydraw can do it. We love a good challenge and trying new things. So let us know what you think! And be prepared.. we have another awesome Yswipe video coming out in the next few weeks…it will blow your mind! So be smart!..and get the new Yswipe video…the Ydraw version of a typical cut out video.
The length of your online marketing video is a very important key for success; second only to creating great content. If this is surprising, you haven’t spent enough time on the web. On the internet, attention is the new currency. If you want to boost sales and watch your business grow, you need to figure out how to get people to pay attention to your company. The easiest and most convenient way for consumers to learn about your company is through video, but in order to best utilize this tool, you need to know about human online-viewing habits.
Where’d Everybody Go?
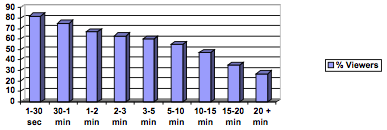
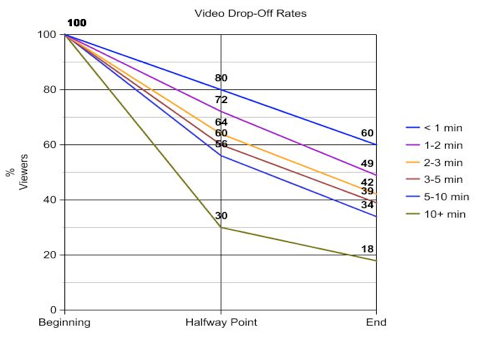
The internet has all but wiped out our patience as a species. With faster and faster internet speeds, there is no reason to wait or sit through anything when it comes to the web. There is a direct correlation between the length of a video and the abandonment rate; the longer the video the higher the drop-off rate. In a study done by the University of Massachusetts, researchers discovered that after clicking ‘play,’ roughly 6% of the audience departs every second. After only five to ten seconds a mere 80% of viewers remained. This means you’ve got less than five seconds to capture a person’s attention if you want them to hear your full message.
But wait – there’s more:
Most viewers decide quickly whether or not they want to watch, and once they’ve made their decision, usually stick around until the end. However, this varies dramatically with the length of the video. Halfway through a 30 second video, 80-90% of your viewers are still sticking around – whereas 50% of the way through a ten minute video, you’ve only retained about 30% of your audience.
So with statistics as alarming as these, you want to do everything you can to ensure your company produces an interesting video that people will want to watch. Ideally, you would be able to pack your entire message into a brilliant, captivating, twenty second video – but let’s get real; what else we got?
Your Options
The type of video carrying your message has a large impact on viewer abandonment rates. The graphs and statistics above are generalized and include all types of video formats. Let’s look at the main types of videos in those averages and see what we’re dealing with:
Pre-roll ads – If you’re thinking about launching your video as a pre-roll ad feeding off the views of a more popular video, just know that pre-roll ads have abandonment rates as high as 70%, and that’s for a video only thirty seconds long. If you want to let people know about your company and want to better your chances of people listening to your entire message, this is not the route for you.
Live action ads – The statistics for live action ads, for the most part, parallel the graphs above. They average 6-7% drop per second viewed. This isn’t terrible, it’s the same as most videos, and if you create unique content you have a shot at your video being above average – but there is something better.
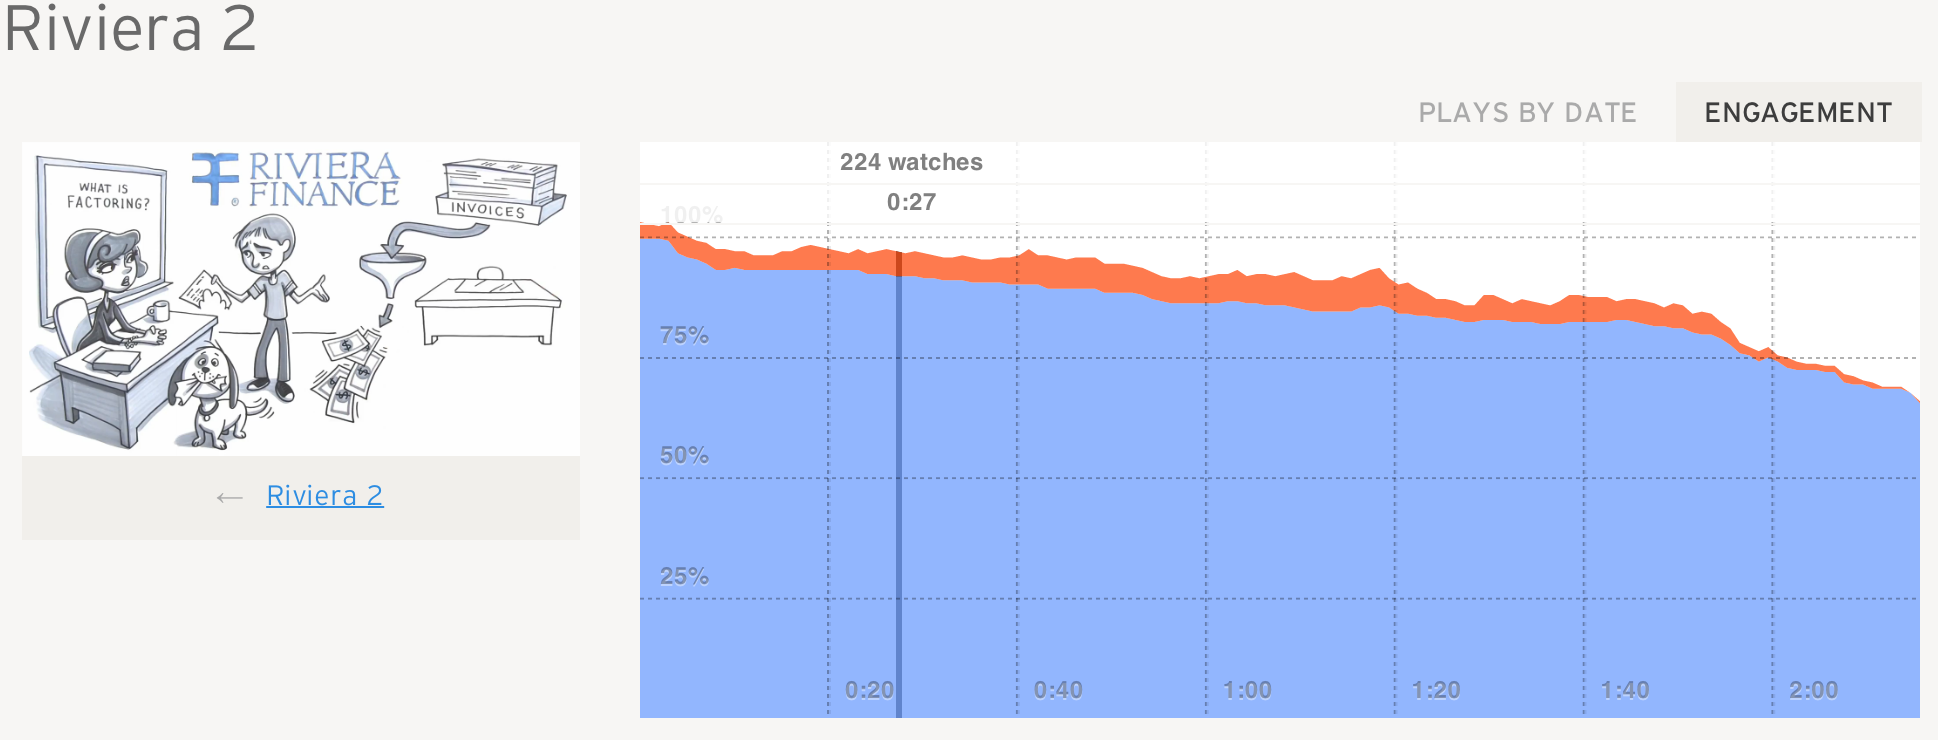
Whiteboard animation ads – Whiteboard animation is the most interactive form of online advertising. It has been proven to catch consumers’ attention quicker and keep them watching for longer. Feast your eyes on some of the statistics we’ve found specifically for whiteboard animation videos. We even put in the screen shot of our live video stats so you can see a comparison.
Live Video Drop Off Rate Is 50%
While the video engagement rate drops to 80% after 30 seconds on the average marketing video, whiteboard animation videos don’t reach that level until after the one minute mark. Viewer retention is still above 75% even after two and a half minutes.
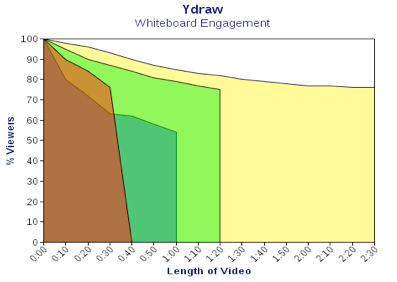
To get a better idea of the averages we took our four most viewed videos and put the collected data into this graph:
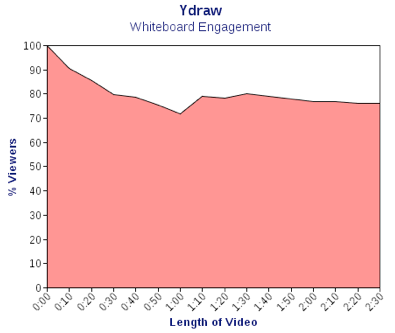
As always, viewer retention varies with the length of the video, but on average whiteboard animation hooks viewers faster and keeps them for longer. The graph below shows the average of the combined four videos:
Whiteboard videos have a drop of 25% over two minutes of video; unlike the other types of marketing videos that see a 35-55% drop in viewers. As a matter of fact, while the average video struggles to retain viewers as length increases, we’ve found that the longer the whiteboard animation video, the better our retention rates were. Meaning a lot more people were willing to watch for a lot longer.
If you’ve got a message you just can’t squeeze into thirty seconds and feel every word is important for your target audience to hear, you need a whiteboard video. It’s your best chance to get your product or service out there without people disregarding it because of boredom or impatience. Whiteboard videos are incredibly engaging – watching an illustration materialize before your eyes is hypnotizing. It is easy to get caught up in the artwork and feel as if you are right there with the artist.
Not only are the viewer statistics above average, whiteboard animation is also very affordable. If you want your video to have the best chance of being seen without breaking your budget, you need to get in touch with us. In this world of ever-competitive internet global marketing, why wouldn’t you take advantage of all the ways available to give your company the edge?