Infographics and Video Scribing
Let’s talk infographics. You might be asking, what is an infographic? Well, keep reading and I’ll tell you of course! An infographic is a visual representation of information or data. Think of them as very informative, very detailed pie charts or bar graphs, but funner.
Infographics make boring ol’ stats more appealing to read. They add color and images to the information that you are trying to deliver. They are more attention grabbing than just a sheet of paper or a slide with a bunch of information printed on it. It draws the viewer in to the information. It causes their eyes to search the whole image or paper to make sure they have read all the information that it provided. And it can do all of this while showing valuable information. It’s much easier for a person’s brain to understand what’s happening if you show them a visual example as well as facts, an infographic does just that, without causing boredom either!
Infographics are also much more memorable and therefore persuasive. What would you rather see, a presentation filled with statistics on a boring slide, or a colorful image representation of those facts? Your attention is going to be driven towards the images much more and you’re going to feel as though that presentation was much better and put together, with the presenter putting in much more time than the other.
So how do infographics translate into video scribes? Well, if you create an infographic it can act as a rough draft for your video. It gives you a good preview of what your video could look like, much like storyboarding would do.
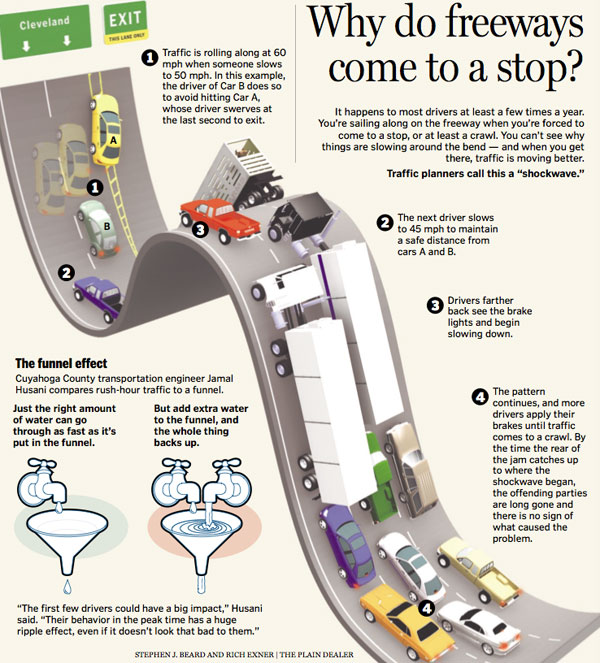
Below is a great way to show why traffics jams happen. Now imagine if you combine this infographic with a video scribe. It would make for a great unforgettable presentation.
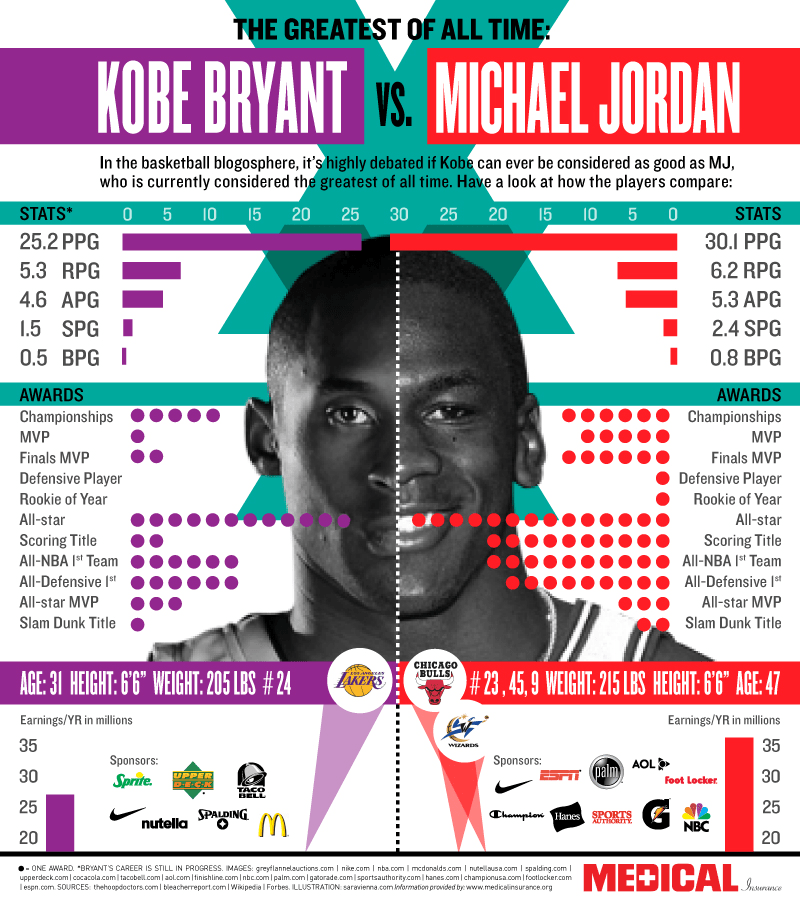
Plus, infographics are just fun. Here you have it. Michael Jordan is far better then Kobe Bryant, but they are both great players. I have always wondered who was better and this infographic was a perfect way to show the stats.

